

· Executive Brief
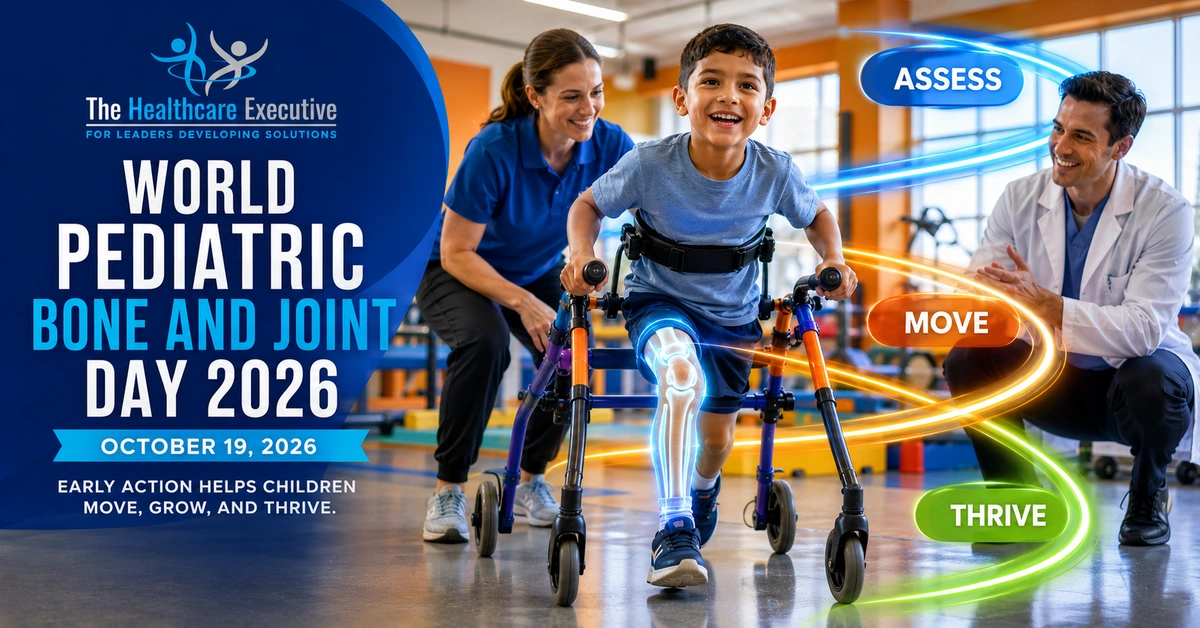
World Pediatric Bone and Joint Day 2026
Use the observance to align communication, service routes, community partners, measures, and accountable follow-through.

Leadership signal
Recognition becomes useful when leaders inspect the real route.
Leaders can use the campaign window to bring partners around one operating map. Clarify the intended audience, approved message, receiving channels, accountable teams, transition points, and the small set of locally defined signals that will show whether the route worked.
Start by distinguishing what is known from what the organization still needs to learn. A campaign plan, communication volume, or meeting count does not establish that a route is usable. Leaders need direct listening, clear ownership, locally defined measures, and a method for keeping exceptions visible.
Executive opening
Children’s bone and joint care is an access system, not a single clinic
Most children who break a bone or develop a hip, spine or limb problem never see a hospital ward. They move through urgent care, emergency departments, imaging, casting clinics, therapy and school. Each step is run by a different team, and many are run by different organizations. That makes pediatric musculoskeletal care a test of how well a health system coordinates, not only how well it treats.
The volume is steady and rising. A national Danish cohort counted 668,595 extremity fractures in children aged 0 to 15 years between 1999 and 2018, an overall rate of 3,164 per 100,000 persons per year.[2] The same study found that the overall rate increased over the period.[2] Fractures are a routine, high-volume service line, which is exactly why small process failures repeat thousands of times.
The evidence that follows points to a consistent pattern. Children are often seen quickly at the front door, then wait, travel or drop out at the next step. Gaps cluster by insurance, race, language and neighborhood. They also widen at the age when adolescents leave pediatric services. None of these gaps requires new clinical science to close. They require clear ownership of the interval between one service and the next, and data that show who is waiting longest.
This brief adds that evidence to the operating guidance already on this page. It covers burden and measurement, the continuum from injury or screening to recovery, physical and financial access, equity, the specialist and support workforce, and how families receive information. Each section is written for leaders who own capacity, contracts and accountability rather than clinical decisions. Where a study’s setting differs from a U.S. health system, the text says so, and the figures are reported as published.
Current evidence
What the research says about volume, patterns and the limits of the data
Population data show where demand concentrates. In the Danish cohort, the lower arm had both the highest share and the highest incidence of fractures.[2] Incidence rose with age and was higher in boys.[2] Upper and lower leg fractures decreased over the 20 years, while other sites increased.[2] The authors suggest these patterns can help health systems coordinate resources.[2] For a regional system, that means casting, imaging and clinic slots should follow the age and injury mix actually arriving, rather than historical templates.
Patterns are similar in very different settings. At three public hospitals in Addis Ababa, 182 of 648 children seen for trauma had fractures, an incidence of 28% among injured children.[5] Falls caused 79% of injuries, and the upper limb was the most common injury site (73%).[5] Children aged 6 to 10 years carried the highest risk.[5] For executives, the message is that upper-limb fracture care is the core workload to design around.
The youngest children need a different lens. A systematic review of 12 studies found an annual fracture incidence of 5.3 to 9.5 per 1,000 children aged 0 to 2 years.[8] Falls from a low height caused 50% to 60% of fractures in four of those studies.[8] The authors stress that good-quality incidence data for this age group are scarce.[8] Such data help clinicians distinguish accidental from inflicted injury, so data quality is a safeguarding issue as well as a planning one.[8]
Measurement also shapes what leaders see at the trauma door. In a national trauma registry analysis of 97,773 children aged 15 or younger, 15,985 (16%) needed pediatric trauma center resources.[1] An Injury Severity Score at the common threshold of 15 had only 36% sensitivity for that need, while a resource-based score reached 89% to 95%.[1] The authors suggest redefining pediatric undertriage around resource-based metrics rather than mortality-based scores.[1]
Taken together, the studies support three planning assumptions. Volume is high and concentrated in upper-limb injuries. Data on the youngest children and on triage accuracy are thinner than leaders may assume. And any internal dashboard should state its denominator, because most published rates count only children who reached a given door. Leaders who ask for local fracture volume by site, age and payer will usually find the data already exist in scheduling and coding systems. What is often missing is someone assigned to read them.
Figure 1
Injured children waited longer for first pain relief in some groups
Time to first dose of any emergency department analgesia, in minutes, by race and ethnicity. Values are copied from the cited studies [4]; none is estimated.
Data note. All four values come from one study, cohort and definition, so they can be compared directly with one another, but they are unadjusted group values and do not establish cause.
Limitation. Secondary analysis limited to children transported by EMS to pediatric emergency departments; time to first opioid dose did not differ significantly by group.
Figure data (4 rows)
| Measure | Value | Population, setting and year as reported | Source |
|---|---|---|---|
| Hispanic children | 55% | 55 minutes (minimum to maximum, 2 to 369); injured children transported by EMS to 10 U.S. pediatric emergency departments; 480 eligible children in total | [4] |
| Non-Hispanic Black children | 38% | 38 minutes (4 to 379); same multicenter cohort | [4] |
| Non-Hispanic White children | 37% | 37 minutes (4 to 345); same multicenter cohort | [4] |
| Other or multiracial children | 32% | 32 minutes (9 to 188); same multicenter cohort; difference across groups P = 0.0148 | [4] |

Continuum of care
Where the pathway from injury or screening to recovery breaks
The continuum often fails between the first visit and the specialist. In a review of 516 children seen in a pediatric emergency department and followed in an orthopedic clinic, the mean time to the first outpatient visit was 8.54 days.[11] That interval is a handoff, not a clinical decision, and it is one leaders can measure directly. The same study found that the interval was not evenly shared across families, a pattern examined in the equity section below.[11]
Transfers are another fragile link. In a study of 62 children transferred for a nonurgent supracondylar elbow fracture, 18 traveled by ambulance and 44 by private vehicle.[15] Average transfer time was 3.9 hours by ambulance and 4.1 hours by private vehicle, over similar distances.[15] Ambulance transfer cost $647.83 against $28.23 by private vehicle, and no neurovascular deficits were observed.[15] Children waited an average of 16.1 hours from injury to surgery.[15] The authors called for provider education, telemedicine and better care coordination to limit unnecessary transfers.[15]
Developmental conditions depend on timed screening rather than injury. In the Netherlands, hip ultrasound screening for developmental dysplasia normally occurs at about 3 months of age.[6] When pandemic disruption paused screening, delayed screening rose to 57.6% of infants in 2020 from 36.7% in 2019.[6] Mean age at screening rose to 17.3 weeks from 15.8 weeks.[6] Delayed screening was not associated with worse outcomes at one year in that study, but the episode shows how quickly a scheduled program slips when capacity is interrupted.[6]
The final break comes at adulthood. Among 39 young people aged 17 to 28 with cerebral palsy or related neuromuscular conditions at one referral center, only 20.5% had a transfer of care plan.[7] Sixty-nine percent had no orthopedic surgeon overseeing their bone and joint health.[7] Fifty-six percent reported a decline in musculoskeletal health.[7] A pediatric service that ends without a receiving adult team has handed off risk, not care.
Recovery itself is a long phase of the continuum. Parents interviewed after a child’s displaced wrist fracture were still describing recovery five to 11 months after the injury.[9] Their accounts covered casting, return to activities and lingering worries, well beyond the last clinic visit.[9] A pathway that measures only the first treatment misses most of what families experience.
Figure 3
Why the pathway breaks
People
- Pediatric orthopedic surgeons concentrated in some areas, leaving surgical deserts
- Front-door decisions judged against adult-derived severity thresholds
- No named adult orthopedic or physical therapy team after transfer
Process
- Multi-day interval between emergency visit and first orthopedic visit
- Nonurgent fractures transferred by ambulance by default
- No written transfer of care plan for adolescents
Technology
- Virtual fracture clinic lacks a staffed helpline or open return route
- Scheduling lag between booking and visit
- Online education not available in families’ languages
Environment
- Long travel distances and limited transport
- Neighborhood deprivation linked to missed visits
- Screening programs paused when capacity is disrupted
Policy
- Insurance type and self-pay status linked to slower follow-up
- Pediatric services end at a fixed age without adult receiving agreements
- Prevention counseling not built into routine well-child visits
Measurement
- Undertriage defined by mortality-based scores rather than resource need
- Time to analgesia and follow-up not stratified by race, language or insurance
- Scarce good-quality incidence data for the youngest children
Unranked qualitative cause-and-effect diagram for the outcome in the box: Children with fractures or developmental musculoskeletal conditions do not reach timely specialist follow-up, recovery support or adult care Causes are assembled from the cited literature [1], [3], [6], [7], [8], [10], [11], [12], [13], [14], [15]; categories are not weighted and their order carries no meaning.
Data note. Qualitative; no frequencies are implied.
Limitation. Causes drawn from published studies may not all apply locally; validate them with frontline teams.
Figure data (6 rows)
| Category | Causes drawn from the cited literature |
|---|---|
| People | Pediatric orthopedic surgeons concentrated in some areas, leaving surgical deserts; Front-door decisions judged against adult-derived severity thresholds; No named adult orthopedic or physical therapy team after transfer |
| Process | Multi-day interval between emergency visit and first orthopedic visit; Nonurgent fractures transferred by ambulance by default; No written transfer of care plan for adolescents |
| Technology | Virtual fracture clinic lacks a staffed helpline or open return route; Scheduling lag between booking and visit; Online education not available in families’ languages |
| Environment | Long travel distances and limited transport; Neighborhood deprivation linked to missed visits; Screening programs paused when capacity is disrupted |
| Policy | Insurance type and self-pay status linked to slower follow-up; Pediatric services end at a fixed age without adult receiving agreements; Prevention counseling not built into routine well-child visits |
| Measurement | Undertriage defined by mortality-based scores rather than resource need; Time to analgesia and follow-up not stratified by race, language or insurance; Scarce good-quality incidence data for the youngest children |
Access
Making specialist, virtual and follow-up care reachable
Access in pediatric musculoskeletal care is about getting the right child to the right level of care, then keeping them there. Missed visits are a measurable leak. In 10,078 encounters at a pediatric orthopedic clinic and its affiliated academic hospital in 2019, the no-show rate was 6.61%.[14] Race and insurance type were significant predictors of missed appointments.[14]
Neighborhood disadvantage compounds the problem. In a matched analysis within the same study, the authors used the Area Deprivation Index to quantify socioeconomic risk and reported a link between appointment adherence and socioeconomic factors.[14] Leaders can use that finding to target reminder, transport and scheduling support to the families most likely to miss care, rather than spreading it evenly. Scheduling and outreach are levers a health system controls directly, which makes them a natural place to start.
Virtual models can absorb low-risk volume. A systematic review of six studies of pediatric virtual fracture clinics found that children were seen within 72 hours of presentation and most were discharged directly from the virtual clinic.[13] Missed fractures were limited, re-presentation rates were similar to face-to-face clinics, and the model produced cost savings and high parent satisfaction.[13] The authors judged virtual clinics safe for most stable, low-risk fractures when a telephone helpline and an open return policy are in place.[13]
Transfer decisions are also access decisions. The supracondylar fracture study found that families driving their own child arrived in a similar time to those sent by ambulance, at a fraction of the cost.[15] Clear criteria for which children need a transfer, and which can be seen locally or virtually, protect specialist capacity for the children who need it most. In the same study, children were discharged an average of 25.7 hours after injury.[15] Every avoidable transfer adds to that time for a family and to the load on a receiving center.
Workforce distribution sets the outer limit of access. A national workforce analysis found that demand for pediatric orthopedic surgeons is met in many areas, but surgical deserts remain.[3] Adult orthopedic surgeons also perform a significant volume of pediatric surgery.[3] Access planning therefore has to include community surgeons and referral agreements, not only the children’s hospital. Those agreements work best when they define which fractures stay local, which move to virtual review and which transfer, so that each partner knows its share of the volume.
Executive guidance · System route
Map the path from first contact to verified follow-through.
Use this route as a discussion framework. Replace each stage with the organization’s approved process, qualified roles, current service capacity, and applicable requirements. Do not infer a clinical protocol from the observance title.
The route at a glance
- Define the purpose
- Align the entry point
- Include the family route
- Manage response
- Review the campaign
Reliability rule: Every stage needs a named owner, an observable status, an approved escalation path, and a defined signal that shows whether responsibility moved or remained unresolved.
Define the purpose
Name the audience, intended action, approved message, and limits of what the campaign can responsibly promise.
Align the entry point
Connect every communication channel to current information and a clearly identified receiving role or team.
Include the family route
Use locally approved methods to include the patient, family, or authorized caregiver as appropriate while keeping role, privacy, and next-step ownership clear.
Manage response
Keep questions, referrals, exceptions, and unresolved work visible until an accountable receiver accepts them.
Review the campaign
Compare intended action with local process signals and partner feedback, then document the improvement to carry forward.
Figure 2
The system route as one flow
The five stages of the system route described in this brief, drawn as one flow with a learning loop back to the start. The stages are the page’s original executive guidance, not a clinical protocol.
Data note. Shows sequence and handoffs only; it carries no counts or rates.
Limitation. Local processes may add, merge or reorder stages under organizational policy.
Figure data (5 rows)
| Stage | What the stage requires |
|---|---|
| Define the purpose | Name the audience, intended action, approved message, and limits of what the campaign can responsibly promise. |
| Align the entry point | Connect every communication channel to current information and a clearly identified receiving role or team. |
| Include the family route | Use locally approved methods to include the patient, family, or authorized caregiver as appropriate while keeping role, privacy, and next-step ownership clear. |
| Manage response | Keep questions, referrals, exceptions, and unresolved work visible until an accountable receiver accepts them. |
| Review the campaign | Compare intended action with local process signals and partner feedback, then document the improvement to carry forward. |
Equity and trust
Equity gaps appear in pain relief, follow-up and information
Equity gaps appear early in the musculoskeletal pathway. In a multicenter study of 480 injured children transported by emergency medical services to 10 pediatric emergency departments, 353 (73.5%) received analgesia in the emergency department.[4] The median time to first analgesia of any kind was 39 minutes.[4] Timing differed by race and ethnicity. Time to the first dose was 55 minutes for Hispanic children, 38 minutes for non-Hispanic Black children, 37 minutes for non-Hispanic White children and 32 minutes for children of other or multiple races.[4] Time to the first opioid dose did not differ significantly.[4] Long bone fractures were associated with a higher likelihood of receiving analgesia.[4] The authors call for research into root causes, which places the question squarely in operations and quality review.
Follow-up shows a similar pattern. Time to the first orthopedic visit after an emergency department fracture visit was associated with race, insurance status, ZIP-code income and age.[11] Missed appointments were predicted by race and insurance type, and adherence was linked to socioeconomic factors.[14] These are system signals. They point to scheduling rules, transport, referral routing and payer contracts that leaders control.
Language access is part of equity. Among 49 top-ranked pediatric orthopedic hospitals, 79.6% offered English online education about slipped capital femoral epiphysis, but only 34.7% offered Spanish materials.[12] A family that cannot read the instructions cannot follow the pathway, however well it is designed.
Prevention offers an equity lever as well. A cluster randomized trial of injury prevention counseling at well-child visits enrolled 781 parent and infant pairs, 87% of whom were Medicaid-insured.[10] The program was delivered at four academic medical centers during well-child visits from 2 to 24 months of age.[10] Sites using the program had significantly lower adjusted odds of parent-reported injuries, with an adjusted odds ratio of 0.27 at 24 months.[10] Participants were 51% Hispanic and 28% non-Hispanic Black.[10] Embedding prevention in routine primary care reached families who are often underrepresented in injury research.
For leaders, the practical step is stratification. Each of these studies found differences only because someone split the data by race, ethnicity, insurance, language or neighborhood. Internal reports on pain relief, follow-up and missed visits should be built the same way, with results reviewed alongside the teams who can change them.

Human infrastructure
The surgeons, triage teams and support staff who carry the pathway
The specialist pipeline is growing. Membership of the national pediatric orthopedic society rose from 904 in 2014 to 1,125 in 2022.[3] Fellowship programs trained an average of 57.5 new pediatric orthopedic surgeons a year, and 73 positions were offered each year as of 2022.[3] The authors estimate that training about 49 fellows a year would meet current and future demand.[3]
Supply does not equal reach. The same analysis found that surgical deserts persist, and that a slight surplus may emerge mainly in urban areas.[3] The authors also describe a scope expanding into sports, hand and spine surgery, along with transitional care into early adulthood.[3] Executives should read national adequacy as a distribution problem that local recruitment, outreach clinics and partnerships must solve. A children’s hospital that does not plan with community surgeons will see both crowded clinics and empty regions.
Front-door teams carry much of the risk. The registry study defined undertriage as a child needing pediatric trauma center resources but being treated at a center lacking them.[1] Current mortality-based severity systems were derived from adult data and have shown greater accuracy for adults than for injured children.[1] Triage accuracy is a training, staffing and audit question as much as a clinical one, and it depends on who is on shift.
Support roles hold the continuum together. Young adults with cerebral palsy reported gaps in both orthopedic and physical therapy oversight after leaving pediatric services, with 33.3% reporting no physical therapist supervision.[7] Respondents who still received ongoing orthopedic care reported high satisfaction.[7] The study was conducted at a single National Health Service referral center.[7] Local gaps may be larger or smaller, which is a reason to measure them. That contrast suggests the problem is a missing receiving team, not the care itself.
Virtual fracture clinics shift work rather than remove it. They rely on a consultant-led team that reviews cases before a telephone consultation, on staff who answer a telephone helpline, and on an open return policy.[13] Leaders who adopt the model need to fund those roles explicitly, or the savings reappear as unplanned returns. Primary care teams are part of the musculoskeletal workforce too. The injury prevention trial relied on screening and counseling delivered by trained pediatric residents during routine well-child visits.[10] Schedulers matter as well, since the clinic study recommended individualizing care plans around families’ socioeconomic needs to improve appointment adherence.[14] Workforce plans that count only surgeons will miss the roles that keep children moving through the pathway.
Executive guidance · Operating dashboard
Measure whether the operating route works as intended.
Do not publish a number until the organization defines its numerator, denominator where relevant, owner, source system, exclusions, review cadence, and limits. The candidates below are management prompts, not benchmarks or reported results.
Four operating signals
Each signal pairs an executive question with one candidate local measure, set out below.
Executive guidance · Signal
Message alignment
Do channels and partners communicate one current and appropriately bounded route?
- Candidate local measure
- Content review status, conflicting instructions, corrections, and unresolved questions.
Executive guidance · Signal
Response ownership
Does every campaign-generated request reach an accountable receiver?
- Candidate local measure
- Routing, acknowledgment, repeat contact, unresolved work, and escalation signals.
Executive guidance · Signal
Family-centered usability
Can patients, families, or authorized caregivers understand the entry point, responsible team, and next step where appropriate?
- Candidate local measure
- Locally defined communication barriers, repeated contacts, support requests, unresolved handoffs, and experience feedback.
Executive guidance · Signal
Action closure
Did leaders complete and verify the improvement selected for the campaign window?
- Candidate local measure
- Assigned action, status, evidence of completion, and post-action review.
Figure 4
The operating system behind the dashboard
The four operating signals from this brief’s dashboard, each tied to the candidate owner named in the executive scorecard, around one accountable route. Drawn from the page’s original executive guidance.
Data note. Structural diagram; no measured values.
Limitation. Owners are candidates to be confirmed locally.
Figure data (4 rows)
| Operating signal | Candidate owner |
|---|---|
| Message alignment | Executive sponsor and operational lead |
| Response ownership | Operational owner and participating teams |
| Family-centered usability | Sending and receiving owners |
| Action closure | Improvement owner and executive sponsor |
Executive guidance · Handoff workflow
Keep work owned when it crosses a boundary.
A handoff is reliable only when the sending party knows who is expected to receive the work, the receiving party acknowledges responsibility, and any unresolved exception remains visible. Local policy and qualified judgment control the actual process.
How responsibility moves
Lane A
From message to accepted ownership
- Confirm the approved message and intended audience.
- Publish the actual entry point and receiving role.
- Acknowledge receipt using the locally approved method.
- Escalate when ownership or response remains unclear.
Lane B
From accepted ownership to verified follow-through
- Record the next accountable owner and visible status.
- Confirm the approved communication route for the patient, family, or authorized caregiver as locally appropriate.
- Keep unresolved work visible across boundaries.
- Confirm closure or document the continuing exception.
Executive guidance · Executive scorecard
Ask questions that connect intent, ownership, and results.
The scorecard keeps review focused on decisions. Leaders should set definitions locally, examine variation without overclaiming cause, and pair quantitative signals with the experience of people who use and operate the route.
Who reviews what
- Executive sponsor and operational lead
- Operational owner and participating teams
- Sending and receiving owners
- Improvement owner and executive sponsor
Candidate owners named in the scorecard, confirmed locally.
| Operating signal | Executive question | Candidate owner | Suggested review point |
|---|---|---|---|
| Message alignment | Do channels and partners communicate one current and appropriately bounded route? | Executive sponsor and operational lead | At campaign launch and close |
| Response ownership | Does every campaign-generated request reach an accountable receiver? | Operational owner and participating teams | At a locally defined cadence |
| Family-centered usability | Can patients, families, or authorized caregivers understand the entry point, responsible team, and next step where appropriate? | Sending and receiving owners | At a locally defined cadence |
| Action closure | Did leaders complete and verify the improvement selected for the campaign window? | Improvement owner and executive sponsor | Until action is verified |
Figure 5
Control points for a reliable pediatric bone and joint pathway
| Control point | Risk if missing | Owner | Evidence of control |
|---|---|---|---|
| Booked orthopedic follow-up before the child leaves the emergency department or urgent care | Multi-day waits for the first specialist visit, longer for some groups | Emergency department medical director with orthopedic clinic manager | Days from index visit to first orthopedic visit, stratified by race, insurance and ZIP code |
| Transfer criteria for nonurgent fractures | Costly ambulance transfers with no added benefit and strained specialist capacity | Transfer center lead and pediatric orthopedic section chief | Share of nonurgent fracture transfers by mode, with review of exceptions |
| Virtual fracture clinic safety net | Families lose a route back if symptoms change | Ambulatory operations lead | Helpline answer rate and documented open return policy |
| Equity review of time to analgesia | Unequal pain relief remains invisible | Chief quality officer with emergency nursing leadership | Time to first analgesia by race, ethnicity and language, reviewed each quarter |
| Protected infant hip screening schedule | Screening slips past the target age when capacity is disrupted | Imaging director and newborn services lead | Share of infants screened by the target age, monitored during disruptions |
| Adolescent transfer of care plan with a named adult team | Young adults lose orthopedic and therapy oversight | Chief medical officer with adult and pediatric service chiefs | Share of eligible adolescents with a written plan and a completed first adult visit |
| Plain-language, translated family materials | Families cannot follow instructions or know when to return | Patient experience officer and language services lead | Reading-level audit and availability in the leading languages served |
Control points derived from the cited evidence [4], [6], [7], [9], [11], [12], [13], [15] and this brief’s executive guidance.
Data note. Each row is a control to verify, not a measured result.
Limitation. Owners and evidence of control must follow local policy and applicable requirements.
Public communication
Communicating with families in ways they can use
Families judge musculoskeletal care by recovery they can see. In interviews with 20 parents from 13 hospitals, conducted five to 11 months after a child’s displaced wrist fracture, parents in both treatment groups considered their child recovered by one year.[9] Recovery rested on acceptance that the child had received the best treatment, memories of the injury, and pride in how the child coped.[9]
Parents also named what they lacked. The authors concluded that families would benefit from more educational support about uncertainty, loss of confidence, worry about reinjury and the appearance of the wrist.[9] Those are predictable questions. They can be answered in discharge materials, follow-up calls and clinic scripts written before the next child arrives. Parents who know what normal recovery looks like are better placed to recognize when something is not normal.
Written materials are often too hard to read. Medical and federal health bodies recommend patient education at sixth-grade and eighth-grade reading levels respectively.[12] In a review of online materials for slipped capital femoral epiphysis, English resources scored at a grade level of 11.9 against 10.4 for Spanish resources on the comparison measure.[12] Only 34.7% of the hospitals reviewed offered Spanish materials at all.[12]
Prevention messages need a delivery channel, not only a campaign. The injury prevention trial delivered screening and counseling during routine well-child visits from 2 to 24 months of age.[10] Adjusted odds of parent-reported injury at those sites were 0.32 at 12 months and 0.27 at 24 months.[10] Messages tied to an existing visit reached families repeatedly, which a single observance day cannot do.
Public communication should also set honest expectations about access. A virtual fracture clinic works when parents know how to reach the helpline and when they may return without a new referral.[13] Communicating that route clearly is part of the safety design, not an add-on to it. Transfer conversations are communication moments too. In the supracondylar fracture study, families transporting their own child arrived in a similar time to ambulance transfers, and no neurovascular deficits were observed.[15] When clinicians can explain why a child may travel by car or be seen locally, the plan is easier for a family to follow and to trust.

Executive guidance · 90-day plan
Move from listening to a verified improvement in 90 days.
The time boxes below are a management framework, not a clinical timeline. Adjust them to risk, scope, governance, resources, stakeholder participation, and applicable review requirements.
Ninety days, three moves
- Days 1–30See the current route
- Days 31–60Build the reliable path
- Days 61–90Make the change visible
Days 1–30 · Listen and map
See the current route
- Name an executive sponsor and an operational owner.
- Listen to people using the route and representative frontline teams.
- Map how World Pediatric Bone and Joint Day communications connect to real entry points, owners, transitions, and escalation.
- Select one recurring barrier that the organization can responsibly address.
Days 31–60 · Design and test
Build the reliable path
- Define the trigger, receiving owner, required information, acknowledgment, escalation, and closure signal.
- Validate the design with every sending and receiving team involved.
- Validate one access or transition route with patients, families, or authorized caregivers as locally appropriate.
- Test the route in more than one representative setting or operating period where practical.
Days 61–90 · Implement and verify
Make the change visible
- Launch the redesigned route with a small set of locally defined measures.
- Review unresolved work and recurring friction using a learning approach.
- Correct implementation barriers and record who owns each remaining dependency.
- Report what changed, what evidence was reviewed, and what still requires live oversight.
Figure 6
The 90-day plan on one timeline
The 90-day plan from this brief drawn as a timeline: each action sits in the 30-day window the plan assigns it. The full wording of each action is in the figure data and in the plan above.
Data note. Time boxes are a management framework, not a clinical timeline.
Limitation. Durations are uniform 30-day windows; real tasks may span windows.
Figure data (12 rows)
| Window | Action |
|---|---|
| Days 1–30 · Listen and map | Name an executive sponsor and an operational owner. |
| Days 1–30 · Listen and map | Listen to people using the route and representative frontline teams. |
| Days 1–30 · Listen and map | Map how World Pediatric Bone and Joint Day communications connect to real entry points, owners, transitions, and escalation. |
| Days 1–30 · Listen and map | Select one recurring barrier that the organization can responsibly address. |
| Days 31–60 · Design and test | Define the trigger, receiving owner, required information, acknowledgment, escalation, and closure signal. |
| Days 31–60 · Design and test | Validate the design with every sending and receiving team involved. |
| Days 31–60 · Design and test | Validate one access or transition route with patients, families, or authorized caregivers as locally appropriate. |
| Days 31–60 · Design and test | Test the route in more than one representative setting or operating period where practical. |
| Days 61–90 · Implement and verify | Launch the redesigned route with a small set of locally defined measures. |
| Days 61–90 · Implement and verify | Review unresolved work and recurring friction using a learning approach. |
| Days 61–90 · Implement and verify | Correct implementation barriers and record who owns each remaining dependency. |
| Days 61–90 · Implement and verify | Report what changed, what evidence was reviewed, and what still requires live oversight. |
Executive guidance · Leadership close
Carry one accountable improvement beyond the campaign window.
Recognition matters. It becomes durable when leaders also listen, clarify the route, support the people operating it, close an identified gap, and report the result without claiming more than the evidence supports.
Leadership commitment
Listen to the people closest to the route, assign one barrier, and verify the change.
Executive action kit · Day observance
Turn World Pediatric Bone and Joint Day into accountable action.
Use the observance to align communication, service routes, community partners, measures, and accountable follow-through.
Leadership focus
Use this observance to examine trustworthy information, prevention access, and community connection. Select one verified barrier, assign an accountable owner, and carry the improvement beyond the campaign window.
Workforce lens
Ask whether staffing, role clarity, training, tools, workload, and escalation support the people operating the family-centered information, access, coordination, and follow-through pathway.
Patient and community lens
Make the approved first step clear. Test whether a person can move from information to an acknowledged next action without navigating conflicting instructions.
Equity and access lens
Review caregiver language, disability access, transportation, digital access, school coordination, and differences in the ability to navigate the approved route.
Five-minute briefing
Inspect the operating sequence
Listen with children, families, pediatric teams, schools, community partners, and operational leaders. Find one a confusing entry point, an unacknowledged family concern, or a transition without a named owner, then test the locally approved route from entry through acknowledged follow-through.
- Define the purpose
- Align the entry point
- Include the family route
- Manage response
- Review the campaign
Leadership actions for this week
- Name an executive sponsor and frontline operating owner.
- Ask people using and operating the pathway where ownership becomes unclear.
- Test one representative route from first question to acknowledged next step.
- Select one barrier that can be corrected without overstating the evidence.
- Set a review date and define how completion will be verified.
Candidate measures
Define every numerator, denominator where relevant, owner, data source, exclusions, cadence, and limitation locally. These are management prompts, not external benchmarks.
- Content review status, conflicting instructions, corrections, and unresolved questions.
- Routing, acknowledgment, repeat contact, unresolved work, and escalation signals.
- Locally defined communication barriers, repeated contacts, support requests, unresolved handoffs, and experience feedback.
Department readiness checklist
- The public and staff entry points match the actual approved process.
- A specific role accepts each request, referral, or escalation.
- Handoffs include acknowledgment and a visible unresolved state.
- Language, disability, digital, transportation, and trust barriers receive explicit review.
- Communications do not introduce unsupported themes, statistics, or clinical advice.
- A named leader will review what changed after the observance.
Intended audiences
- Executive and Operational Leaders
- Public Health and Community Partners
Staff communication template
During World Pediatric Bone and Joint Day, our organization will connect awareness with a practical review of the family-centered information, access, coordination, and follow-through pathway. Use approved information, identify the correct entry point, confirm ownership when work moves, protect privacy, and escalate unresolved barriers through local channels.
Community communication template
World Pediatric Bone and Joint Day is an opportunity to share trustworthy information and make the next step easier to find. Use our approved channels for information and support. If a request changes hands, our goal is to keep ownership and follow-through visible.
Measurement worksheet
- Signal
- What observable condition will show whether the route works?
- Definition
- What is included, excluded, and counted?
- Owner
- Who reviews the signal and acts on exceptions?
- Cadence
- When will leaders review it?
- Equity check
- Which differences require protected, locally appropriate review?
- Closure
- What evidence will confirm the improvement was completed?
- Editorial review
- Completed
- Source records
- 2 listed under Authoritative resources
- Review standard
- Sourced facts remain separated from original executive guidance
- Clinical boundary
- No new statistical or clinical claim was added by this action kit
Sources and content boundary
Authoritative resources
Use note: All operating models, measures, scorecard questions, and action steps are original executive guidance. This article supports leadership planning and education. It does not replace clinical judgment, emergency procedures, legal advice, professional standards, organizational policy, or applicable federal, state, and local requirements.
Peer-reviewed references
References
Fifteen peer-reviewed sources, newest first. Each was individually verified through authenticated academic research databases. Bracketed numbers in the text link here; the original executive guidance on this page carries no citations because it is guidance, not a sourced claim. Sources last checked in those databases on .
- 1.Crosier CJ, Mehmood A, Thatch K, Cisela DJ, Pracht EE, Snyder CW. Pediatric Trauma Undertriage: Working Toward a Better Threshold Based on Trauma Center Resource Utilization. Children. 2026;13(1):95. https://doi.org/10.3390/children13010095
- 2.Lund AR, Færgemann C, Gundtoft P, Viberg B. National rates of pediatric extremity fractures over a 20-year timespan in Denmark: a population-based descriptive cohort study. Acta Orthopaedica. 2026;97:204-208. https://doi.org/10.2340/17453674.2026.45511
- 3.Cho RH, Sheffer BW, Shah AS, Glotzbecker MP, Schmitz MR, Heffernan MJ, et al. Pediatric Orthopaedic Workforce in 2022: Current Workforce, Projections, and Trends in the United States. Journal of the Pediatric Orthopaedic Society of North America. 2025;13:100251. https://doi.org/10.1016/j.jposna.2025.100251
- 4.Kerolle S, Browne LR, Brazauskas R, Adelgais KM, Chadha K, Chang TP, et al. Racial and Ethnic Differences in ED Analgesia Among Injured Children Transported Via EMS. Pediatric Emergency Care. 2025;41(8):606-611. https://doi.org/10.1097/PEC.0000000000003389
- 5.Muzemil S, Mekasha A, Muzemil F, Barega MT, Eanga S. Incidence and patterns of pediatric fractures at selected hospitals in Addis Ababa, Ethiopia, 2024: a multi-center cross-sectional study. Frontiers in Pediatrics. 2025;13:1501900. https://doi.org/10.3389/fped.2025.1501900
- 6.Hinloopen JH, Donker DJ, van Linge JH, van Bergen CJA, van Douveren FQMP, Foreman-van Drongelen M, et al. Impact of the COVID-19 Pandemic on the Dutch Screening Program for Developmental Dysplasia of the Hip—Delayed Screening and One-Year Outcomes. Children. 2025;12(5):538. https://doi.org/10.3390/children12050538
- 7.Sagade B, Thorn C, Ross P, May C, Davies E, Rad D, et al. Transfer of musculoskeletal care from paediatric to adult services for patients with cerebral palsy and chronic neuromuscular conditions: Identifying the unmet need. Health Care Transitions. 2024;2:100078. https://doi.org/10.1016/j.hctj.2024.100078
- 8.Rosendahl K, de Horatio LT, Habre C, Shelmerdine SC, Patsch J, Kvist O, et al. The incidence of fractures in children under two years of age: a systematic review. BMC Musculoskeletal Disorders. 2024;25(1):528. https://doi.org/10.1186/s12891-024-07633-5
- 9.Phelps EE, Tutton E, Costa ML, Achten J, Gibson P, Moscrop A, et al. Being recovered: a qualitative study of parents’ experience of their child’s recovery up to a year after a displaced distal radius fracture. Bone & Joint Open. 2024;5(5):426-434. https://doi.org/10.1302/2633-1462.55.BJO-2024-0024
- 10.Perrin EM, Skinner AC, Sanders LM, Rothman RL, Schildcrout JS, Bian A, et al. The Injury Prevention Program to Reduce Early Childhood Injuries: A Cluster Randomized Trial. Pediatrics. 2024;153(5):e2023062966. https://doi.org/10.1542/peds.2023-062966
- 11.Gupta SK, Troyer LD, Si Z, Gieg SD, Leary EV. Race, Income, and Insurance Status Are Associated with Increased Time to Initial Outpatient Evaluation of Fracture Patients. Journal of the Pediatric Orthopaedic Society of North America. 2024;8:100070. https://doi.org/10.1016/j.jposna.2024.100070
- 12.Grellinger ED, Swarup I. Barriers to Health Care Communication: Patient Education Resource Readability and Spanish Translation for Slipped Capital Femoral Epiphysis. Journal of the Pediatric Orthopaedic Society of North America. 2024;8:100076. https://doi.org/10.1016/j.jposna.2024.100076
- 13.Waite E, Ahmed Z. How safe and effective are paediatric virtual fracture clinics? A systematic review. Frontiers in Digital Health. 2023;5:1261035. https://doi.org/10.3389/fdgth.2023.1261035
- 14.Malloy M, Tarima S, Canales B, Nelson D, Hanley J. Identifying Risk Factors for Appointment No-Shows in a Pediatric Orthopaedic Surgery Clinic. Journal of the Pediatric Orthopaedic Society of North America. 2023;5(3):695. https://doi.org/10.55275/JPOSNA-2023-695
- 15.Mechas C, Mayer R, Iwinski H, Riley SA, Talwalkar V, Prusick V, et al. The Costs of Interfacility Transfers for Nonurgent Pediatric Supracondylar Fractures. Journal of Pediatric Orthopaedics. 2022;42(7):e727-e731. https://doi.org/10.1097/BPO.0000000000002177
Claim-to-source matrix
What each source supports
Every sourced claim in the new sections maps to the references that support it, the section where it is used, and the limitation a reader should keep in mind. Original executive guidance carries no sources because it is guidance, not a finding.
| Claim group | Sources | Years | Used in | Limitation |
|---|---|---|---|---|
| Pediatric fracture volume, sites, age and sex patterns | [2] [5] | 2026, 2025 | Current evidence | Danish registry data from 1999 to 2018 and a short cross-sectional study in three Ethiopian public hospitals; neither is a U.S. population. |
| Fracture incidence in children under two and data quality | [8] | 2024 | Current evidence | Twelve heterogeneous studies; authors describe good-quality data as scarce. |
| Defining pediatric trauma undertriage by resource need | [1] | 2026 | Current evidence | Registry analysis of children at participating trauma centers; the resource-based score was derived and applied within registry data. |
| Delay from emergency visit to orthopedic follow-up and its social correlates | [11] | 2024 | Continuum of care | Single-center retrospective chart review; associations confounded by multiple factors. |
| Cost and timing of nonurgent supracondylar fracture transfers | [15] | 2022 | Continuum of care | Small retrospective cohort of 62 transferred patients from 2013 to 2018. |
| Disrupted infant hip screening | [6] | 2025 | Continuum of care | Dutch selective screening program during a pandemic pause; one-year outcomes only. |
| Transfer of musculoskeletal care to adult services | [7] | 2024 | Continuum of care | 39 survey responses from one referral center. |
| Missed appointments and neighborhood deprivation | [14] | 2023 | Access | One clinic and hospital in 2019; deprivation analysis in a matched subsample. |
| Safety and effectiveness of pediatric virtual fracture clinics | [13] | 2023 | Access | Six studies of children with simple undisplaced fractures referred from emergency departments; stable, low-risk fractures only. |
| Pediatric orthopedic workforce supply and distribution | [3] | 2025 | Human infrastructure | Model based on society membership and match data; adult surgeon pediatric volume estimated. |
| Racial and ethnic differences in time to emergency analgesia | [4] | 2025 | Equity and trust | Secondary analysis of EMS-transported children at 10 pediatric emergency departments. |
| Injury prevention counseling in well-child care | [10] | 2024 | Equity and trust | Four academic centers; injuries were parent-reported. |
| Family experience of recovery and information needs | [9] | 2024 | Public communication | Qualitative interviews with 20 parents within a trial setting. |
| Readability and Spanish availability of education materials | [12] | 2024 | Public communication | Online materials for one condition at top-ranked hospitals and three societies. |
About the author
Greg Wahlstrom
MBAHCM
President and Chief Executive Officer, The Healthcare Executive
View Greg’s profile©2014 – 2026 The Healthcare Executive. All rights reserved.