
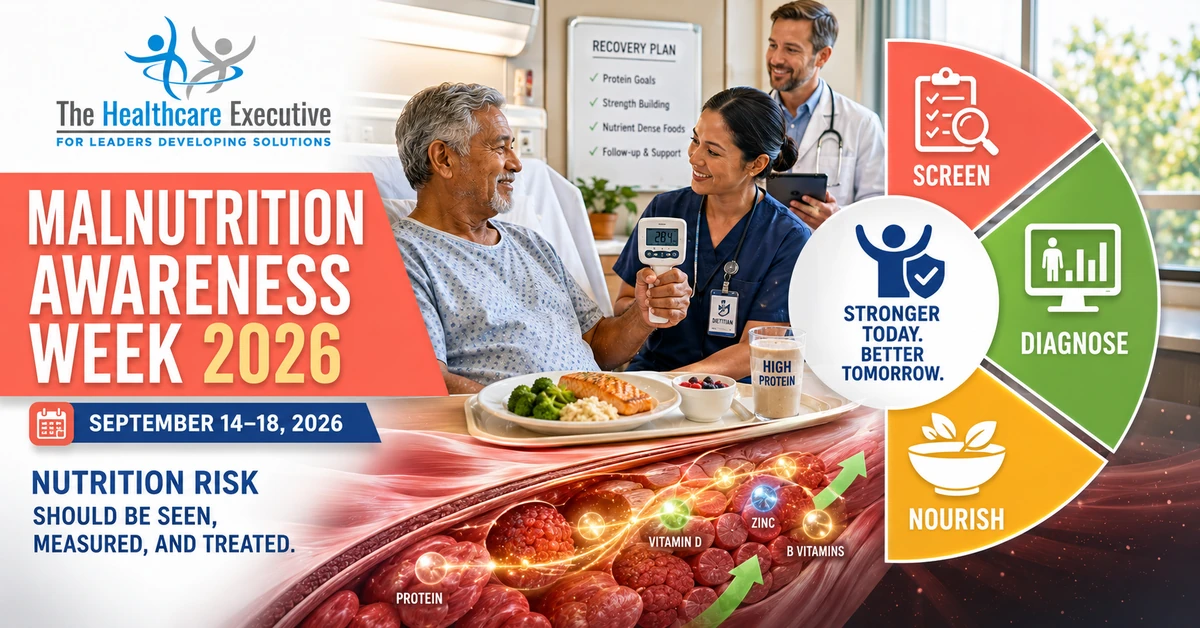

Malnutrition Awareness Week · September 14–18, 2026
Make nutrition care a closed-loop operating responsibility
Awareness becomes accountable action when every person at risk can move from a reliable screen to qualified assessment, diagnosis, an individualized care plan, food and nutrition support that is actually delivered, and a transition that remains visible after discharge.
Observance context. The American Society for Parenteral and Enteral Nutrition identifies Malnutrition Awareness Week as September 14–18, 2026. The campaign was created to educate healthcare professionals, empower patients and consumers, and engage policymakers. This article translates that observance into an executive operating agenda for hospitals and health systems. It does not provide individual medical advice, define a universal diagnostic protocol, or replace qualified assessment, local policy, clinical judgment, or a person’s care team.
The executive accountability case
Treat malnutrition as a pathway problem, not a documentation event
Malnutrition Awareness Week offers leaders a useful checkpoint because nutrition risk is easy to acknowledge and difficult to manage reliably. The work crosses the emergency department, nursing admission, medical and surgical services, dietetics, food and nutrition services, pharmacy, rehabilitation, information technology, case management, finance, outpatient care, and community supports. A failure at any boundary can leave the patient with a completed form but no completed care.
The size of the operational challenge is visible in recent hospital evidence. A 2026 point-prevalence program spanning three metropolitan hospital sites and 5,186 patients found that 21.2% were undernourished, 39.5% were overnourished, and 4.8% were simultaneously under- and overnourished. More than one-third of participants were at risk of undernutrition. Dietitian intervention reached 69.6% of undernourished patients and 70.6% of patients with simultaneous malnutrition, leaving a meaningful gap between identification and specialist intervention.1 The study is descriptive and specific to its health service, but it shows why a health system cannot rely on visual appearance, a low body mass index, or one narrow definition of who may need attention.
Malnutrition can coexist with a larger body size, chronic disease, inflammation, cancer treatment, frailty, swallowing difficulty, functional decline, food insecurity, or acute illness. In a national database study of hospitalized patients receiving maintenance dialysis, obesity without documented malnutrition was associated with lower in-hospital mortality relative to the non-obese group, while obesity with malnutrition was associated with higher mortality. The analysis was observational and depended on administrative data, so it cannot determine causality or replace assessment. It does reinforce an executive warning: body size alone is an unreliable gate for nutrition care.3
The governing question should therefore be larger than whether screening occurs. Leaders need to know whether the organization completes a series of connected actions: valid measurement, timely screening, qualified assessment, diagnostic reconciliation, an actionable plan, meal or supplement delivery, monitoring of intake and tolerance, communication with the patient and family, and a safe transition. The denominator changes at each step. A 98% screening rate can coexist with a much smaller proportion receiving assessment or diagnosis. A nutrition order can coexist with a tray that arrives when the patient is away for a procedure. A discharge recommendation can coexist with no affordable way to obtain the food or supplement.
Those gaps have different owners. Nursing may own the admission screen and actual weight. The registered dietitian nutritionist may own assessment and nutrition diagnosis within scope. The treating clinician may need to reconcile medical diagnoses and orders. Food and nutrition services may own menu availability, timing, and delivery. Rehabilitation professionals may identify positioning, swallowing, or self-feeding needs. Case management may connect coverage and community resources. Information technology may make the next action visible. Executives should name the shared outcome and assign responsibility at each handoff so that multidisciplinary work does not become ownerless work.
Leaders should also resist the temptation to turn awareness into a single product decision. Specialized oral nutrition supplements may be appropriate for some patients, but evidence must be interpreted within population, product, comparator, and design. A 2025 retrospective propensity-matched analysis of 1,440 hospitalized patients at malnutrition risk found lower odds of readmission at one, three, and six months for a high-protein, HMB-enriched supplement compared with a standard supplement, along with modeled savings. The authors described an association, not proof of causation, and the finding does not establish that one formula is appropriate for every patient.6 Governance should support individualized care, formulary review, safety, tolerance, preference, and follow-through rather than a campaign-led protocol.
Evidence chart
Physician-documented malnutrition before and after a targeted quality-improvement initiative
Horizontal scale: 0% to 20%. Unit: percentage of hospital encounters with a physician malnutrition diagnosis.
| Service group | Pre-QI encounters | Pre-QI diagnosis rate | Post-QI encounters | Post-QI diagnosis rate | Reported P value |
|---|---|---|---|---|---|
| Five targeted services | 1,976 | 13.5% | 3,939 | 18.4% | <.0001 |
| Nontargeted services | 8,728 | 6.0% | 18,080 | 7.1% | .0003 |
Board-level question
Can the organization show, with denominators, where patients fall out between a positive screen, qualified assessment, diagnosis, an individualized plan, actual intake, discharge continuity, and follow-up?
Detection and diagnosis
Build a reliable front door without confusing screening with diagnosis
Screening is a rapid method for identifying who may need further evaluation. Diagnosis requires a qualified assessment using an approved framework and clinical judgment. Combining those functions in reporting can inflate apparent performance and create unsafe expectations. A patient may screen positive but not meet diagnostic criteria. Another patient may screen negative and deteriorate later. The operating model should state when screening occurs, which tool is approved for which population, who reviews a positive result, how quickly assessment is expected, and what triggers reassessment.
Recent comparison studies demonstrate why tool choice and workflow matter. In 100 adults screened within 24 hours of hospital admission, the proportion classified as malnourished differed markedly by method: 41% using Global Leadership Initiative on Malnutrition criteria, 60% using Subjective Global Assessment, 72% using Nutritional Risk Screening 2002, and 40% using a modified Nutrition Risk in the Critically Ill score. Agreement with the reference varied across tools.5 A separate study of 510 inpatients found low agreement between the CIPA screen and GLIM assessment, even though positive findings were associated with worse clinical outcomes.10 Neither study supports casually substituting one tool for another.
Executives should require validation in the intended population and setting. A tool that predicts length of stay in one surgical cancer cohort may not perform the same way in general medicine, pediatrics, maternity, behavioral health, or critical care. In a 2026 retrospective study of 374 adults undergoing first-time surgery for esophageal or head and neck cancer, several nutrition indices were associated with prolonged intensive-care and hospital stay, with the Prognostic Nutritional Index showing the highest predictive accuracy in that sample.4 This is useful for risk stratification research, but it does not make the index a universal diagnostic standard.
Reliable detection begins with reliable inputs. Actual weight and height are basic measurements, yet the equipment may be inaccessible, inconveniently located, uncalibrated, or difficult to use for patients with mobility limitations. A quality-improvement project in an emergency assessment unit increased completed Malnutrition Universal Screening Tool scores from 60% to 97% after moving weighing scales to the triage bay.12 The intervention was simple, local, and based on a small denominator, but it demonstrates a durable lesson: leaders should observe the work before assuming that education will overcome a design problem.
Pediatric measurement work shows the same principle at larger scale. Multidisciplinary teams in surgical, cardiac, and intensive-care units tested interventions to improve documentation within 24 hours of admission. Body mass index documentation rose from 11% to 89% in the surgical unit and improved in the other pilots; hospital-wide body mass index documentation rose from 42% to 70%. As measurement improved, identification of moderate or severe undernutrition risk in the pilot units increased from 1.2% to 3.4%.14 Better detection may initially make performance appear worse because the system is finally seeing previously invisible need.

Process flowchart
A closed-loop nutrition care route
- Measure and screenOwner: admission team. Obtain valid inputs, apply the approved tool, and document eligibility or exceptions.
- Route the resultOwner: receiving service. Acknowledge risk, prioritize urgency, and maintain visibility until assessment.
- Assess and reconcileOwner: qualified clinicians. Evaluate etiology, severity, function, intake, and diagnostic agreement.
- Plan and deliverOwner: care team. Match food, supplements, assistance, therapy, medications, and goals to the person.
- Monitor and adaptOwner: daily team. Confirm intake, tolerance, interruptions, progress, preferences, and response.
- Transition and confirmOwner: named transition lead. Complete education, access, handoff, follow-up, and escalation.
Care that reaches the patient
Measure delivered nutrition, not merely ordered nutrition
A care plan has no effect if it cannot survive the daily operating environment. Patients miss meals because of procedures, symptoms, tests, transport, fatigue, swallowing difficulty, positioning, inaccessible packaging, sleep, fasting instructions, or a tray that arrives without needed assistance. Diet restrictions may interact with preferences, faith, culture, sensory needs, allergies, cognition, or clinical requirements. A useful nutrition dashboard therefore goes beyond orders and diagnoses to show whether the intended support was available, accepted, and delivered.
A prospective audit of 892 mealtime observations across 16 acute wards found competing priorities in 59% of observations, poor lighting in 43%, and cluttered tray tables in 41%. One-third of patients required setup or eating assistance. Among those requiring assistance, 18% did not receive it. Conditions varied by ward and meal, with several problems worse at breakfast.13 These findings do not establish a universal prevalence, but they show why average intake can be shaped by the physical and social design of mealtime, not only by appetite or disease.
The improvement response should be multidisciplinary because the barriers are distributed. Nursing may help with positioning, symptom timing, setup, and assistance. Food and nutrition services may improve meal timing, temperature, choice, packaging, nutrient density, and replacement processes. Rehabilitation may support swallowing, cognition, adaptive equipment, or self-feeding. Physicians and procedural teams may reduce avoidable fasting and clarify diet changes. Pharmacy may review medications that affect appetite, nausea, absorption, or meal timing. Environmental services and unit operations may protect space and reduce clutter. Patients and families should help define what is acceptable and realistic.
A nurse-driven mealtime assistance bundle for hospitalized adults age 65 and older used seven care measures and a pre-post design. After implementation, fewer older adults had poor intake, and those at malnutrition risk had higher average intake of meals and protein-dense main dishes. Nursing knowledge, attitudes, and perceived practices also improved.15 Because the project was conducted in one unit without randomization, it should be treated as implementation evidence rather than a guaranteed effect. It does support involving nurses as active nutrition-care partners rather than treating food delivery as a service detached from clinical work.
Executives should ask how interruptions are recovered. If a tray is held for a procedure, who notices when the procedure is delayed or canceled? If the patient eats little, when is intake assessed, and who can change the plan? If assistance is needed, how is that need transmitted across shifts and units? If a culturally appropriate item is unavailable, what safe alternative is offered? If a supplement returns unopened, is it counted as delivered, or is the barrier explored? A closed-loop system distinguishes availability from receipt and receipt from consumption.
Measurement should remain proportionate. Detailed calorie counts may be necessary for selected patients but burdensome and unreliable as a universal metric. A tiered design can use simple intake observation for the broader population, with more intensive monitoring when qualified assessment indicates. The goal is not surveillance for its own sake. It is timely adaptation when the patient’s actual experience diverges from the care plan.

Equity, dignity, and access
Design for the barriers that make a clinically sound plan unusable
Nutrition care is inseparable from access. A patient may not be able to afford the recommended food, obtain transportation, use a delivery service, store food safely, prepare meals, open containers, understand written instructions, or navigate coverage for supplements and supplies. A caregiver may be unavailable. Housing may be unstable. Rural services may lack outpatient dietetics. Language, literacy, disability, and digital access can shape whether the plan is understood and followed. Those are not peripheral social details; they are operating conditions.
Equity also includes cultural safety and the ability to recognize the person in the menu. In a 2026 survey of 370 Indigenous people in Western Canada, 83% agreed that cultural or traditional food options were important in hospital. Respondents named a wide range of desired items and also identified foods they did not want, sometimes placing the same food in both categories.2 The result argues against treating one group as having one menu preference. A culturally safe approach requires local partnership, choice, preparation quality, clinical appropriateness, procurement feasibility, and respect for variation within communities.
Leaders should review access at several levels. At the bedside, ask whether patients can reach, recognize, open, and consume what is provided. At discharge, ask whether the plan fits the person’s household, finances, abilities, beliefs, and local food environment. At the system level, review whether interpreter services, disability accommodations, transportation, community nutrition supports, and outpatient dietetics are connected to the workflow. A referral list is not a completed connection.
Data should be stratified only when definitions, sample size, privacy, and local use are appropriate. Useful dimensions may include site, unit, age, language, race and ethnicity, payer, rurality, disability, discharge destination, and food-access screening. Leaders should avoid ranking small groups or implying causation from descriptive differences. Quantitative results should be paired with listening, chart review, and patient or caregiver partnership so that the organization understands where friction actually occurs.
Qualitative fishbone
Where nutrition care can lose access, time, or ownership
Transitions and continuity
Keep nutrition risk visible after the hospital door closes
Discharge is a high-risk boundary because clinical improvement may mask ongoing nutrition vulnerability. A person may leave with reduced strength, new dietary restrictions, a changed medication regimen, swallowing needs, low appetite, limited food access, or a supplement plan that has not been tested at home. If responsibility becomes ambiguous, the hospital may count the plan as complete while the patient experiences it as a stack of instructions.
A multi-site qualitative study examined how dietitians used an integrated electronic medical record to support transitions for older adults with malnutrition. Its title, “Making the System Work,” captures a common reality: clinicians often compensate for workflow and information gaps through individual effort.8 Executives should not make continuity depend on who remembers to send a note, knows a contact, or searches across modules. The transition should produce a structured summary with nutrition status, current plan, relevant intake and tolerance, functional needs, pending issues, supply requirements, and the named next receiver.
The receiving route should match the person’s situation. Some patients need prompt outpatient dietitian follow-up. Others may need primary care, home health, rehabilitation, social services, community meals, food benefits, pharmacy support, oncology services, or specialist review. The plan should distinguish an order from a scheduled appointment and a referral from confirmed acceptance. If the intended service is unavailable, the sending team needs an escalation or alternative route.
Technology can extend reach, but leaders should evaluate fit and acceptance rather than assuming digital care is easier. In a three-arm randomized trial of 111 adults newly diagnosed with upper gastrointestinal cancer, early intensive nutrition counseling delivered by telephone or a mobile application did not improve quality-adjusted life years or survival compared with usual care. The asynchronous application group had more withdrawals, and behavioral counseling alone did not achieve nutritional adequacy.17 The result is not an argument against telehealth. It is a warning that modality, illness burden, engagement, and the resources required to act on advice all matter.
Transition measurement should include reach and usability. Track whether the patient or caregiver can explain the plan, obtain supplies and food, identify whom to call, and complete the next contact. Record unsuccessful outreach and why it failed. Review whether language, hearing, vision, cognition, transportation, rural distance, device access, or cost contributed. A follow-up percentage without those reasons can hide systematic exclusion.
The pathway should also include a response to deterioration. Local instructions may need to explain which nutrition concerns can wait for a routine call, which require earlier clinical contact, and what symptoms require urgent evaluation. Those instructions must come from qualified local policy and the patient’s care team. The executive responsibility is to ensure that the route is understandable, available, and connected to a receiver, not to publish one universal threshold.

The operating system
Connect governance, workflow, data, and patient partnership
A reliable nutrition program requires an operating system around the pathway. The system begins with governance: an executive sponsor with authority across clinical operations, nursing, medical staff, food and nutrition services, quality, finance, technology, and ambulatory care. Clinical leaders should define approved tools, diagnostic roles, care standards, documentation expectations, and escalation. Patient and caregiver partners should help evaluate whether processes and materials are usable.
Workflow design should be based on observed work. Follow a patient journey from admission through a meal, procedure, unit transfer, and discharge. Watch where equipment is stored, how positive screens are routed, how assessments are prioritized, how diet orders change, how trays are held or replaced, how assistance needs are communicated, and how referrals are sent. A process map created in a conference room may miss the very barriers that determine reliability.
Technology should support the pathway without pretending to own it. A positive screen should create a visible, prioritized task for an accountable receiver. Assessment and diagnosis should be distinguishable. Nutrition plans should be available to the people who deliver meals and assistance without exposing information they do not need. Intake and interruptions should be easy to record and review. Discharge summaries should transmit structured, relevant information. Dashboards should show exceptions and delays, not only completed fields.
Workforce planning needs a demand model. Prevalence, acuity, setting, and time standards can estimate assessment volume, but demand also includes follow-up, complex education, interdisciplinary rounds, discharge coordination, quality improvement, and coverage for absence. A targeted model may direct resources toward units with higher morbidity or known gaps, as the 2022 quality-improvement study did across five services.16 Targeting should be transparent and paired with a safety route for patients outside priority units.
Improvement methods should distinguish process outcomes from patient outcomes. The SIMPLER pathway for fragility fractures was co-created through more than 100 activities, informed by surveys, audits, interviews, and pilot testing across multiple countries. It offers a scalable implementation framework, while its authors note that a global evaluation is underway.7 That is an appropriate evidence boundary. Adoption, endorsement, or tool completion does not by itself demonstrate better health outcomes.
Pediatric QI literature makes a similar case for linking hospital care with discharge planning, outpatient intervention, food insecurity, and quality frameworks.11 Although pediatric and adult services require different tools and standards, the executive architecture is shared: identify risk, route it, deliver care, coordinate transitions, measure balanced outcomes, and learn across settings without erasing population-specific needs.
Operating-system diagram
Six connected controls for reliable nutrition care
Shared aim: the right nutrition support is understood, usable, delivered, monitored, and sustained across settings.
Measurement and learning
Use a balanced scorecard that exposes the handoffs
Measurement should begin with a dictionary, not a dashboard. Define the eligible population, time origin, exclusions, numerator, denominator, data source, accountable owner, cadence, and interpretation limits for every measure. Separate screening completion, positive screens, completed assessments, documented diagnoses, and delivered care plans. These are related but not interchangeable.
Outcome measures require the same discipline. Length of stay, readmission, mortality, function, patient experience, and cost are influenced by illness severity, comorbidity, service line, discharge destination, access, and many other factors. A 2025 study of 1,343 patients undergoing coronary angiography found that nutritional risk independently predicted length of stay, while body mass index did not; the study did not find a significant relationship with in-hospital mortality.9 That association can support local risk review, but it does not prove that changing a screen alone will shorten stays.
Leaders should pair process measures with balancing checks. Faster assessment should not create low-value consult volume that overwhelms the service. Higher supplement use should not obscure waste, intolerance, preference, or contraindications. Protected mealtimes should not delay necessary care. Digital follow-up should not exclude people without devices. Cultural menu options should be evaluated for choice, safety, quality, and actual use rather than counted as a static offering.
Case review supplies context that a rate cannot. Sample a patient with a positive screen and no assessment, a documented diagnosis without a visible plan, a tray interruption, an unplanned readmission, a transition to a rural setting, and a patient or caregiver complaint. Ask where responsibility changed, which information was unavailable, what workarounds occurred, and whether the designed process was usable. Feed the result back to the team with authority to test a change.
Structured management table
Proposed measures for a closed-loop nutrition pathway
| Measure | Definition and denominator | Accountable owner | Review cadence | Equity or balancing check |
|---|---|---|---|---|
| Valid measurement and screen | Eligible admissions with locally required valid inputs and completed approved screen within the defined period, divided by eligible admissions. | Nursing operations | Weekly | Review missing actual weight, equipment access, disability accommodations, exclusions, and accuracy. Completion does not equal diagnosis. |
| Positive-screen routing | Positive screens acknowledged by the named receiver within the locally defined time, divided by all positive screens. | Clinical nutrition leadership | Weekly | Track queue burden, repeat screens, acuity, staffing, and cases outside targeted units. |
| Assessment completion | Eligible patients receiving qualified assessment within the defined period, divided by patients meeting assessment criteria. | Dietetics and clinical service | Weekly | Stratify by unit, shift, language, age, rural site, and payer where appropriate. Review deferrals and refusals. |
| Plan delivered as intended | Sampled patient-days in which ordered food, supplement, assistance, or therapy was available and delivered, divided by eligible sampled patient-days. | Unit and food-service operations | Weekly sample | Review interruptions, waste, intolerance, preference, safe alternatives, positioning, and assistance. |
| Diagnostic reconciliation | Assessed patients with agreement or documented clinical disposition between relevant qualified roles, divided by assessed patients requiring reconciliation. | Medical staff and dietetics | Monthly | Do not use agreement as a target that suppresses judgment. Review definition, documentation burden, and unresolved cases. |
| Transition readiness | Eligible discharges with teach-back, usable plan, supply and food-access review, named receiver, and escalation instructions, divided by eligible discharges. | Transition leadership | Monthly | Measure understanding and access, not document presence. Review language, disability, caregiver, destination, and cost needs. |
| Follow-up connection | Eligible patients with confirmed next contact or documented alternative route within the defined period, divided by eligible patients. | Ambulatory and care management | Monthly | Track failed reach, refusal, digital access, transportation, rural capacity, readmission, and reason for noncompletion. |
A focused implementation agenda
Use 90 days to make ownership and exceptions visible
A 90-day agenda should not claim to solve malnutrition. Its purpose is to establish authority, map the pathway, expose the most consequential failures, and begin a disciplined improvement cycle. The first test should be narrow enough to observe and safe enough to adapt, while still connected to the complete patient journey.
During the first 30 days, name the executive sponsor and clinical co-leads. Confirm which settings and populations are in scope, and document where different tools or standards are required. Map the current state from admission measurement through screening, assessment, diagnosis, meal delivery, monitoring, discharge, and follow-up. Observe several meals and transitions. Review a sample of recent cases, including a missed assessment, an interrupted meal, an unplanned return, and a patient or caregiver concern. Build a measure dictionary and identify data that are missing or unreliable.
The baseline should include capacity and access, not only compliance. Estimate positive screens, assessment demand, time to assessment, dietitian coverage, meal-assistance needs, interrupted meals, discharge destinations, and follow-up availability. Review equipment location and accessibility. Ask frontline staff which workarounds they use. Invite patients, caregivers, and community partners to identify instructions, foods, or referrals that are difficult to use.
By day 60, test one or two high-priority changes in a defined pilot setting. That may include relocating equipment, creating a routed task for positive screens, establishing criteria for rapid assessment, improving physician-dietitian reconciliation, protecting breakfast assistance, creating a tray-recovery process after procedures, or adding structured transition fields. Train the roles that receive the work, simulate exceptions, and monitor workload. A change should be paused or revised if it produces unsafe delay, alert burden, waste, exclusion, or documentation without meaningful action.
By day 90, review the first balanced results with the people who perform and receive the pathway. Compare process data with direct observation and case review. Examine variation by unit, shift, population, and access needs where the sample allows. Decide what to sustain, modify, stop, or expand. Publish an internal improvement brief that states the population, period, definitions, outcomes, limitations, and next decision. Do not describe a planned pathway as implemented or a process gain as a patient outcome.
Malnutrition Awareness Week can then become an annual governance checkpoint. Leaders can report which handoffs are more reliable, which inequities remain, how capacity changed, what patients and staff said, and what the organization learned from null results. The observance is most credible when it reveals unfinished work as clearly as it recognizes progress.
Gantt-style implementation timeline
A proposed 30/60/90-day nutrition reliability sequence
Leadership close
Make the care pathway visible enough to manage
Malnutrition Awareness Week is valuable when it changes what the organization can see and complete. The practical commitment is not a poster, a screening percentage, or a product alone. It is a route in which reliable measurement leads to a valid screen, a positive result reaches a qualified receiver, assessment and diagnosis inform a usable plan, meals and assistance reach the patient, and discharge connects to real access and follow-up.
The evidence does not support one universal tool or intervention. Studies use different populations, definitions, comparators, and outcomes. Some describe associations. Others report local quality-improvement gains. A randomized trial of remote counseling produced a null primary result. Good governance preserves those limits while using the consistent operational lesson: nutrition care depends on connected roles, usable systems, and adaptation to the person and setting.
Executives can make that lesson concrete by reviewing denominators, observing work, listening to patients and caregivers, protecting multidisciplinary capacity, and keeping exceptions visible until someone owns them. The standard is not perfect prediction. It is a system that recognizes risk without stereotyping, acts without losing the handoff, delivers care the patient can use, and remains accountable beyond discharge.
Scholarly references
Peer-reviewed evidence
References are listed newest first by publication year. Findings are interpreted within each study’s population, design, setting, comparator, and limitations.
- Connell, K., Elliott, A., McShane, E., Bramley, A., Hanna, L., & Furness, K. (2026). Screening, characterising and assessing malnutrition in the hospital setting: A large-scale point prevalence survey. Nutrition & Dietetics, 83(3), 326–333. https://doi.org/10.1111/1747-0080.70045
- Conklin, A. I., Tian, D., Janzen, V., Spears, A., Johnson, N., Kaufman, C., & Feeney, S. (2026). Improving hospital nutrition care through “Indigenous cultural safety” of menu options: Results of a cross-sectional survey of Indigenous people in Western Canada. Nutrition in Clinical Practice, 41(1), 266–277. https://doi.org/10.1002/ncp.11352
- Wathanavasin, W., Kaewput, W., Thongprayoon, C., Tangpanithandee, S., Suppadungsuk, S., & Cheungpasitporn, W. (2026). Association of obesity and malnutrition with in-hospital mortality and clinical outcomes in patients receiving maintenance dialysis: A national database study. Nutrients, 18(1), 157. https://doi.org/10.3390/nu18010157
- Lee, C.-Y., Shih, P.-W., Yin, C.-H., Chen, Y.-S., Wu, K.-H., Li, Y.-C., & Su, Y.-C. (2026). Effectiveness of nutritional screening tools in predicting the impact of malnutrition on hospital and intensive care unit stay. Nutrition and Cancer, 78(2), 158–168. https://doi.org/10.1080/01635581.2025.2584487
- Panchal, M., Saseedharan, S., Navade, J., & Gada, M. (2025). Comparison of mNutric score, NRS-2002 score, and SGA score with the gold standard GLIM criteria in the diagnosis of malnutrition. Nutrition and Health, 31(4), 1819–1824. https://doi.org/10.1177/02601060251332990
- Frishman, S., Doyev, R., Ben Lassan, M., Rosenberg, A., Weinstein, O., Sharn, A. R., Kerr, K. W., Sulo, S., & Godny, L. (2025). Nutrition intervention with high-protein and β-hydroxy-β-methylbutyrate is associated with readmission reduction and cost savings among patients with malnutrition risk. Nutrients, 17(22), 3511. https://doi.org/10.3390/nu17223511
- Bell, J. J., Geirsdottir, O. G., Johansen, A., Santy-Tomlinson, J., Frihagen, F., McGlasson, R., Sutton, E., & Hertz, K. (2025). The SIMPLER nutrition pathway for fragility fractures: A quality improvement initiative. Nutrients, 17(12), 1987. https://doi.org/10.3390/nu17121987
- Gomes, K., Roberts, S., Desbrow, B., & Bell, J. (2025). “Making the system work”: A multi-site qualitative study of dietitians’ use of iEMR to support nutrition care transitions for older adults with malnutrition. Healthcare, 13(17), 2227. https://doi.org/10.3390/healthcare13172227
- Popiolek-Kalisz, J., Hollings, M., & Blaszczak, P. (2025). Nutritional risk score predicts the length of stay in patients undergoing coronary angiography. Nutrition & Dietetics, 82(4), 383–391. https://doi.org/10.1111/1747-0080.70019
- Márquez Mesa, E., Guerra Cabrera, A. J., Gómez de Segura, I. L., & Suárez Llanos, J. P. (2024). Comparison of CIPA nutritional screening with GLIM criteria for malnutrition, prognostic evolution, and association with phase angle in hospitalized patients. Nutrients, 16(21), 3652. https://doi.org/10.3390/nu16213652
- Sharn, A. R., Phillips, W., Stutts, J. T., Kaminski, M., Shepps, A., & Arensberg, M. B. (2024). Nutrition-focused quality improvement programs in pediatric care. Children, 11(12), 1434. https://doi.org/10.3390/children11121434
- Shannon, C. (2024). Enhancing the nutritional care of older people by recording actual body weight: A quality improvement project. Emergency Nurse, 32(4), 35–41. https://doi.org/10.7748/en.2023.e2180
- Treleaven, E., Matthews-Rensch, K., Garcia, D., Mudge, A., Banks, M., & Young, A. M. (2024). Mealtimes matter: Measuring the hospital mealtime environment and care practices to identify opportunities for multidisciplinary improvement. Nutrition & Dietetics, 81(4), 436–443. https://doi.org/10.1111/1747-0080.12863
- Persaud, S., Hron, B. M., Rudie, C., Mantell, P., Kahlon, P. S., Ariagno, K., Ozonoff, A., Trivedi, S., Yugar, C., Mehta, N. M., Raymond, M., Duggan, C. P., & Huh, S. Y. (2024). Improving anthropometric measurements in hospitalized children: A quality-improvement project. Nutrition in Clinical Practice, 39(3), 685–695. https://doi.org/10.1002/ncp.11112
- Zhang, D., Tay, L. B. G., Lim, S. F., Ang, J. Y. H., Tong, C. C. Y., Tang, C. Y. L., & Brennan-Cook, J. (2024). Improving nutrition care and diet intake for hospitalised older people at risk of malnutrition through a nurse-driven mealtime assistance bundle. International Journal of Older People Nursing, 19(1), e12590. https://doi.org/10.1111/opn.12590
- Wills-Gallagher, J., Kerr, K. W., Macintosh, B., Valladares, A. F., Kilgore, K. M., & Sulo, S. (2022). Implementation of malnutrition quality improvement reveals opportunities for better nutrition care delivery for hospitalized patients. JPEN Journal of Parenteral and Enteral Nutrition, 46(1), 243–248. https://doi.org/10.1002/jpen.2086
- Huggins, C. E., Hanna, L., Furness, K., Silvers, M. A., Savva, J., Frawley, H., Croagh, D., Cashin, P., Low, L., Bauer, J., Truby, H., & Haines, T. P. (2022). Effect of early and intensive telephone or electronic nutrition counselling delivered to people with upper gastrointestinal cancer on quality of life: A three-arm randomised controlled trial. Nutrients, 14(15), 3234. https://doi.org/10.3390/nu14153234